PK/PD Modeling Dashboards — Gallery
Turn models into decision-ready dashboards. What-if simulations for internal reviews and study teams.
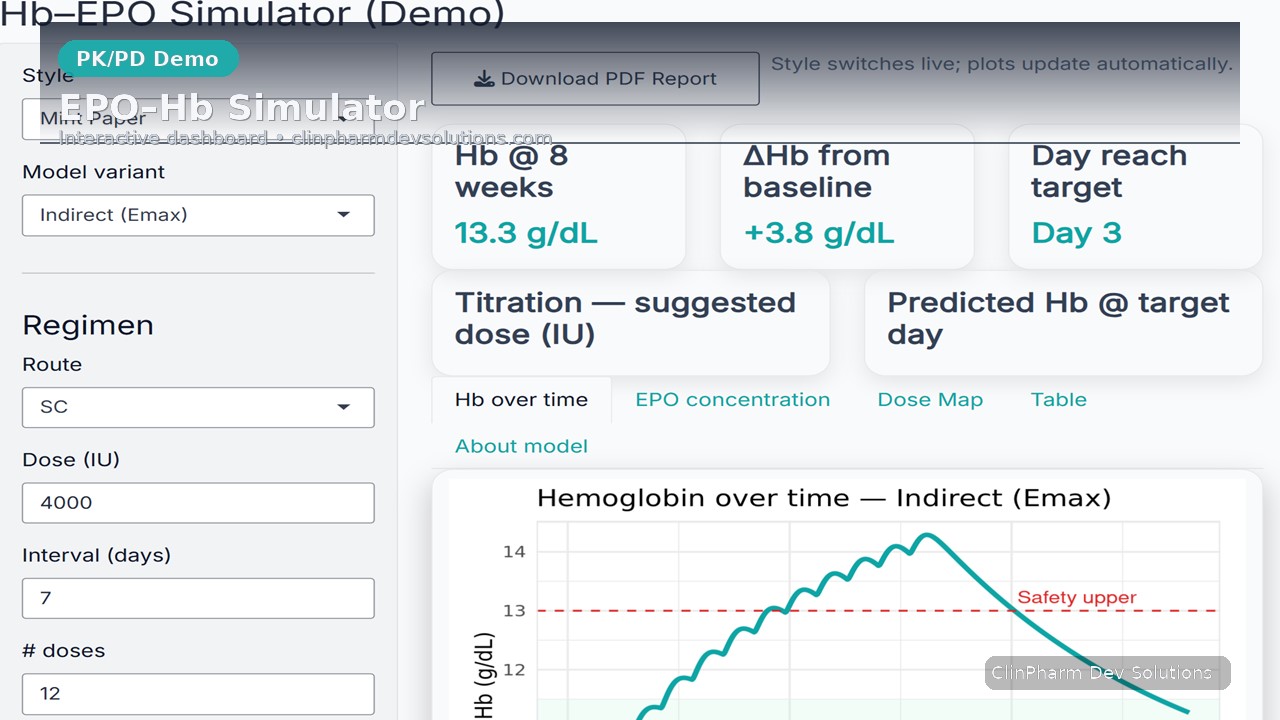
Indirect & transit variants, dose titration helper, dose map, PDF export.
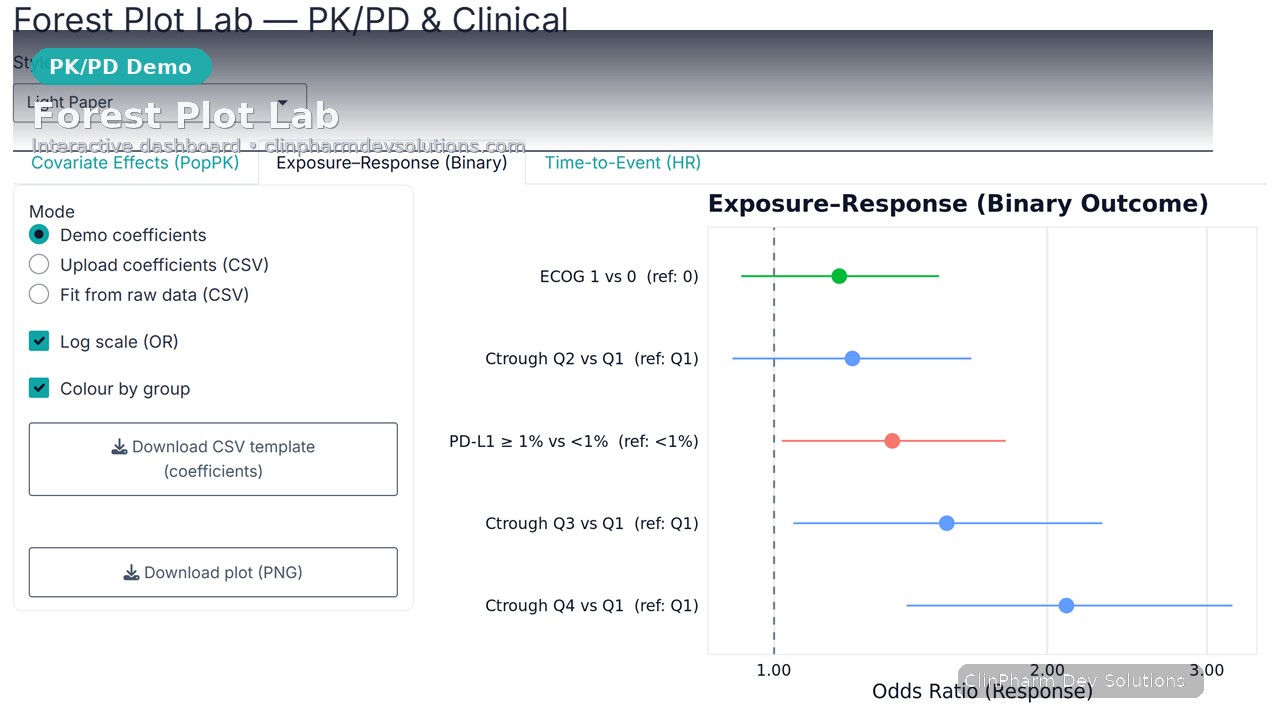
Covariate effects, exposure–response OR, time-to-event HR. Upload CSV or fit from raw data.
Demos only • No PHI • Apps may cold-start on first load.
Make faster, better dose & design decisions.
Turn PK/PD and exposure–response models into interactive dashboards you can use live in internal reviews, cross-functional meetings, and board updates.
What-if in minutes: change dose, interval, MIC, covariates during the meeting—no reruns needed.
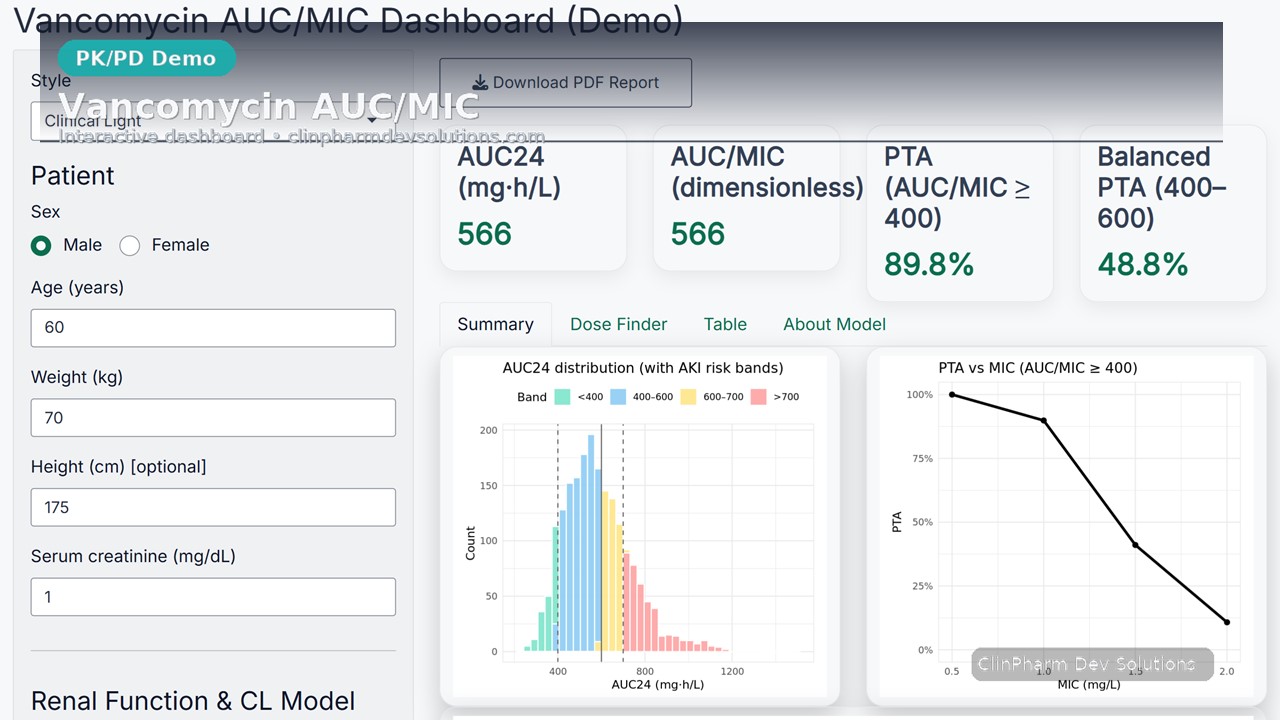
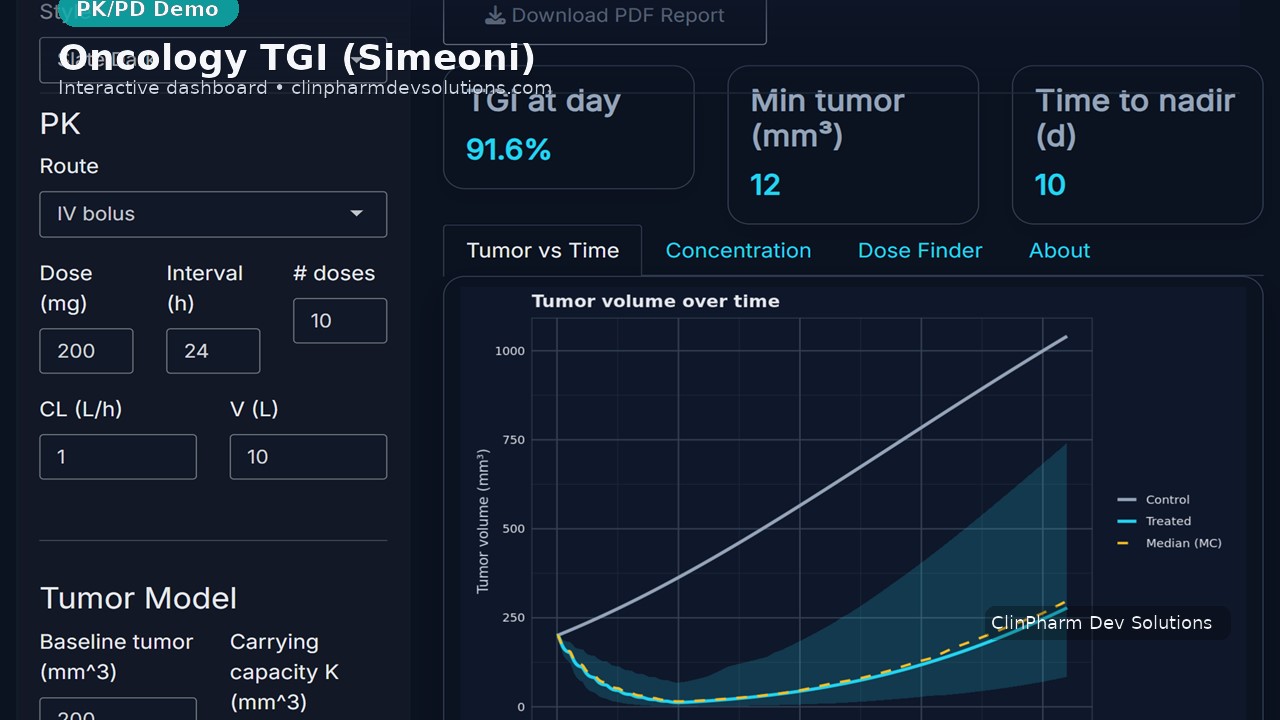
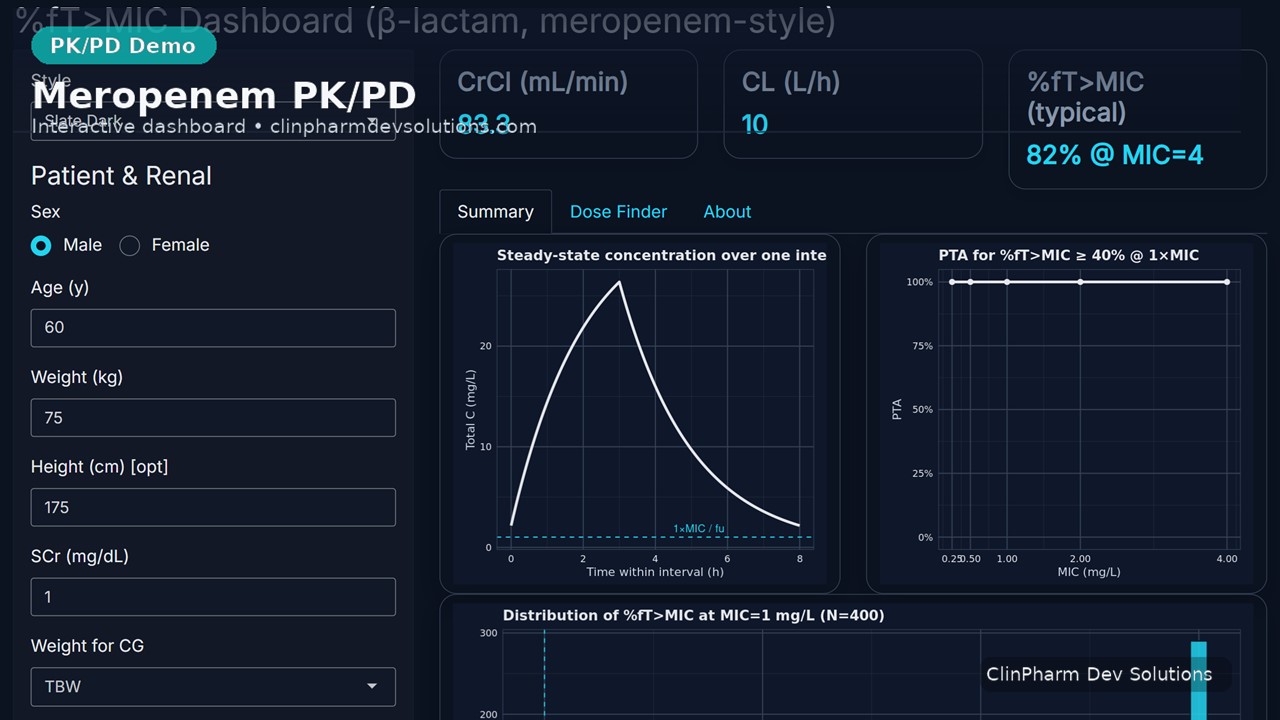
Shared intuition: visual links from exposure → response → decision criteria (AUC/MIC, %fT>MIC, PTA, TGI, PD targets).
Reproducible: one-click PDF/CSV exports for minutes and slide decks.
Low-lift: we wrap your existing model; we don’t need your raw study data for the demo.
Governance-ready: “Demo only • No PHI” gates; optional SSO and access logs.
How a typical pilot works
- Scoping (30 min) — identify the 3–5 decisions your team needs to make.
- Prototype (1–2 weeks) — build a Shiny dashboard on demo parameters.
- Iteration (1 week) — add dose finder/variability, export, and presets.
- Deploy — host on shinyapps.io or your VPS; handoff + quick training.
Use cases
- Internal team reviews, protocol/design selection
- Cross-functional dose justification and risk trade-offs
- Management/board presentations with live scenarios