Model-informed analyses are increasingly recognized by regulators and sponsors as credible evidence—especially when the question is clear, the model is verified for purpose, and uncertainties are transparent. This article reviews real submissions where M&S supported dose selection, regimen bridging, DDI labeling, pediatric dosing, and systems-level benefit–risk insight.
Introduction
In modern drug development, the Common Technical Document (CTD) is no longer a static compilation of study reports—it is a decision narrative. Within that narrative, Model-Informed Drug Development (MIDD) has become the connective tissue linking preclinical findings, clinical data, and regulatory decision-making.
Regulators across the globe—FDA, EMA, PMDA, NMPA—now routinely rely on model-based analyses to justify dose selection, predict drug–drug interactions, support labeling across populations, and even waive clinical studies. Population PK/PD, physiologically based pharmacokinetic (PBPK) modeling, exposure–response (E–R) analysis, and quantitative systems pharmacology (QSP) all contribute unique layers of evidence that strengthen the totality-of-data argument.
Yet despite this acceptance, many submissions still treat models as appendices—buried, fragmented, and detached from the development story. The objective of this article is to demonstrate, through real-world regulatory case studies, how modeling and simulation were used to solve specific development problems and directly influence labeling or regulatory decisions. Each example summarizes:
- The problem being addressed (clinical, logistical, or regulatory)
- The modeling approach and key datasets
- The solution derived from the model
- The regulatory or labeling impact achieved
Together, these case studies trace the evolution of MIDD—from supportive analyses to regulatory evidence. For sponsors of small and mid-size biotech programs, the lessons are practical: well-designed, transparent models—anchored in observed data and expressed in CTD-ready language—can save entire clinical studies, justify flexible regimens, and accelerate approvals.
Case 1 — Exposure Bridging for a Fixed Q6W Regimen (PopPK + E–R)
Problem
Could a fixed 400 mg Q6W regimen provide exposures comparable to established 2 mg/kg Q3W and 200 mg Q3W regimens without new comparative efficacy trials?
Modeling Approach
- PopPK simulations comparing Ctrough and Cave across regimens.
- E–R synthesis from earlier programs (2 mg/kg Q3W, 200 mg Q3W, 10 mg/kg Q2W) plus bridging PK from KEYNOTE-555 Cohort B.
Solution
Observed geometric mean Ctrough (6-week) for 400 mg Q6W ≈ 14.5 μg/mL vs 13.4 μg/mL (2 mg/kg Q3W) and 18.1 μg/mL (200 mg Q3W). Ratios: 1.08× and 0.80×—consistent with FDA conclusions.
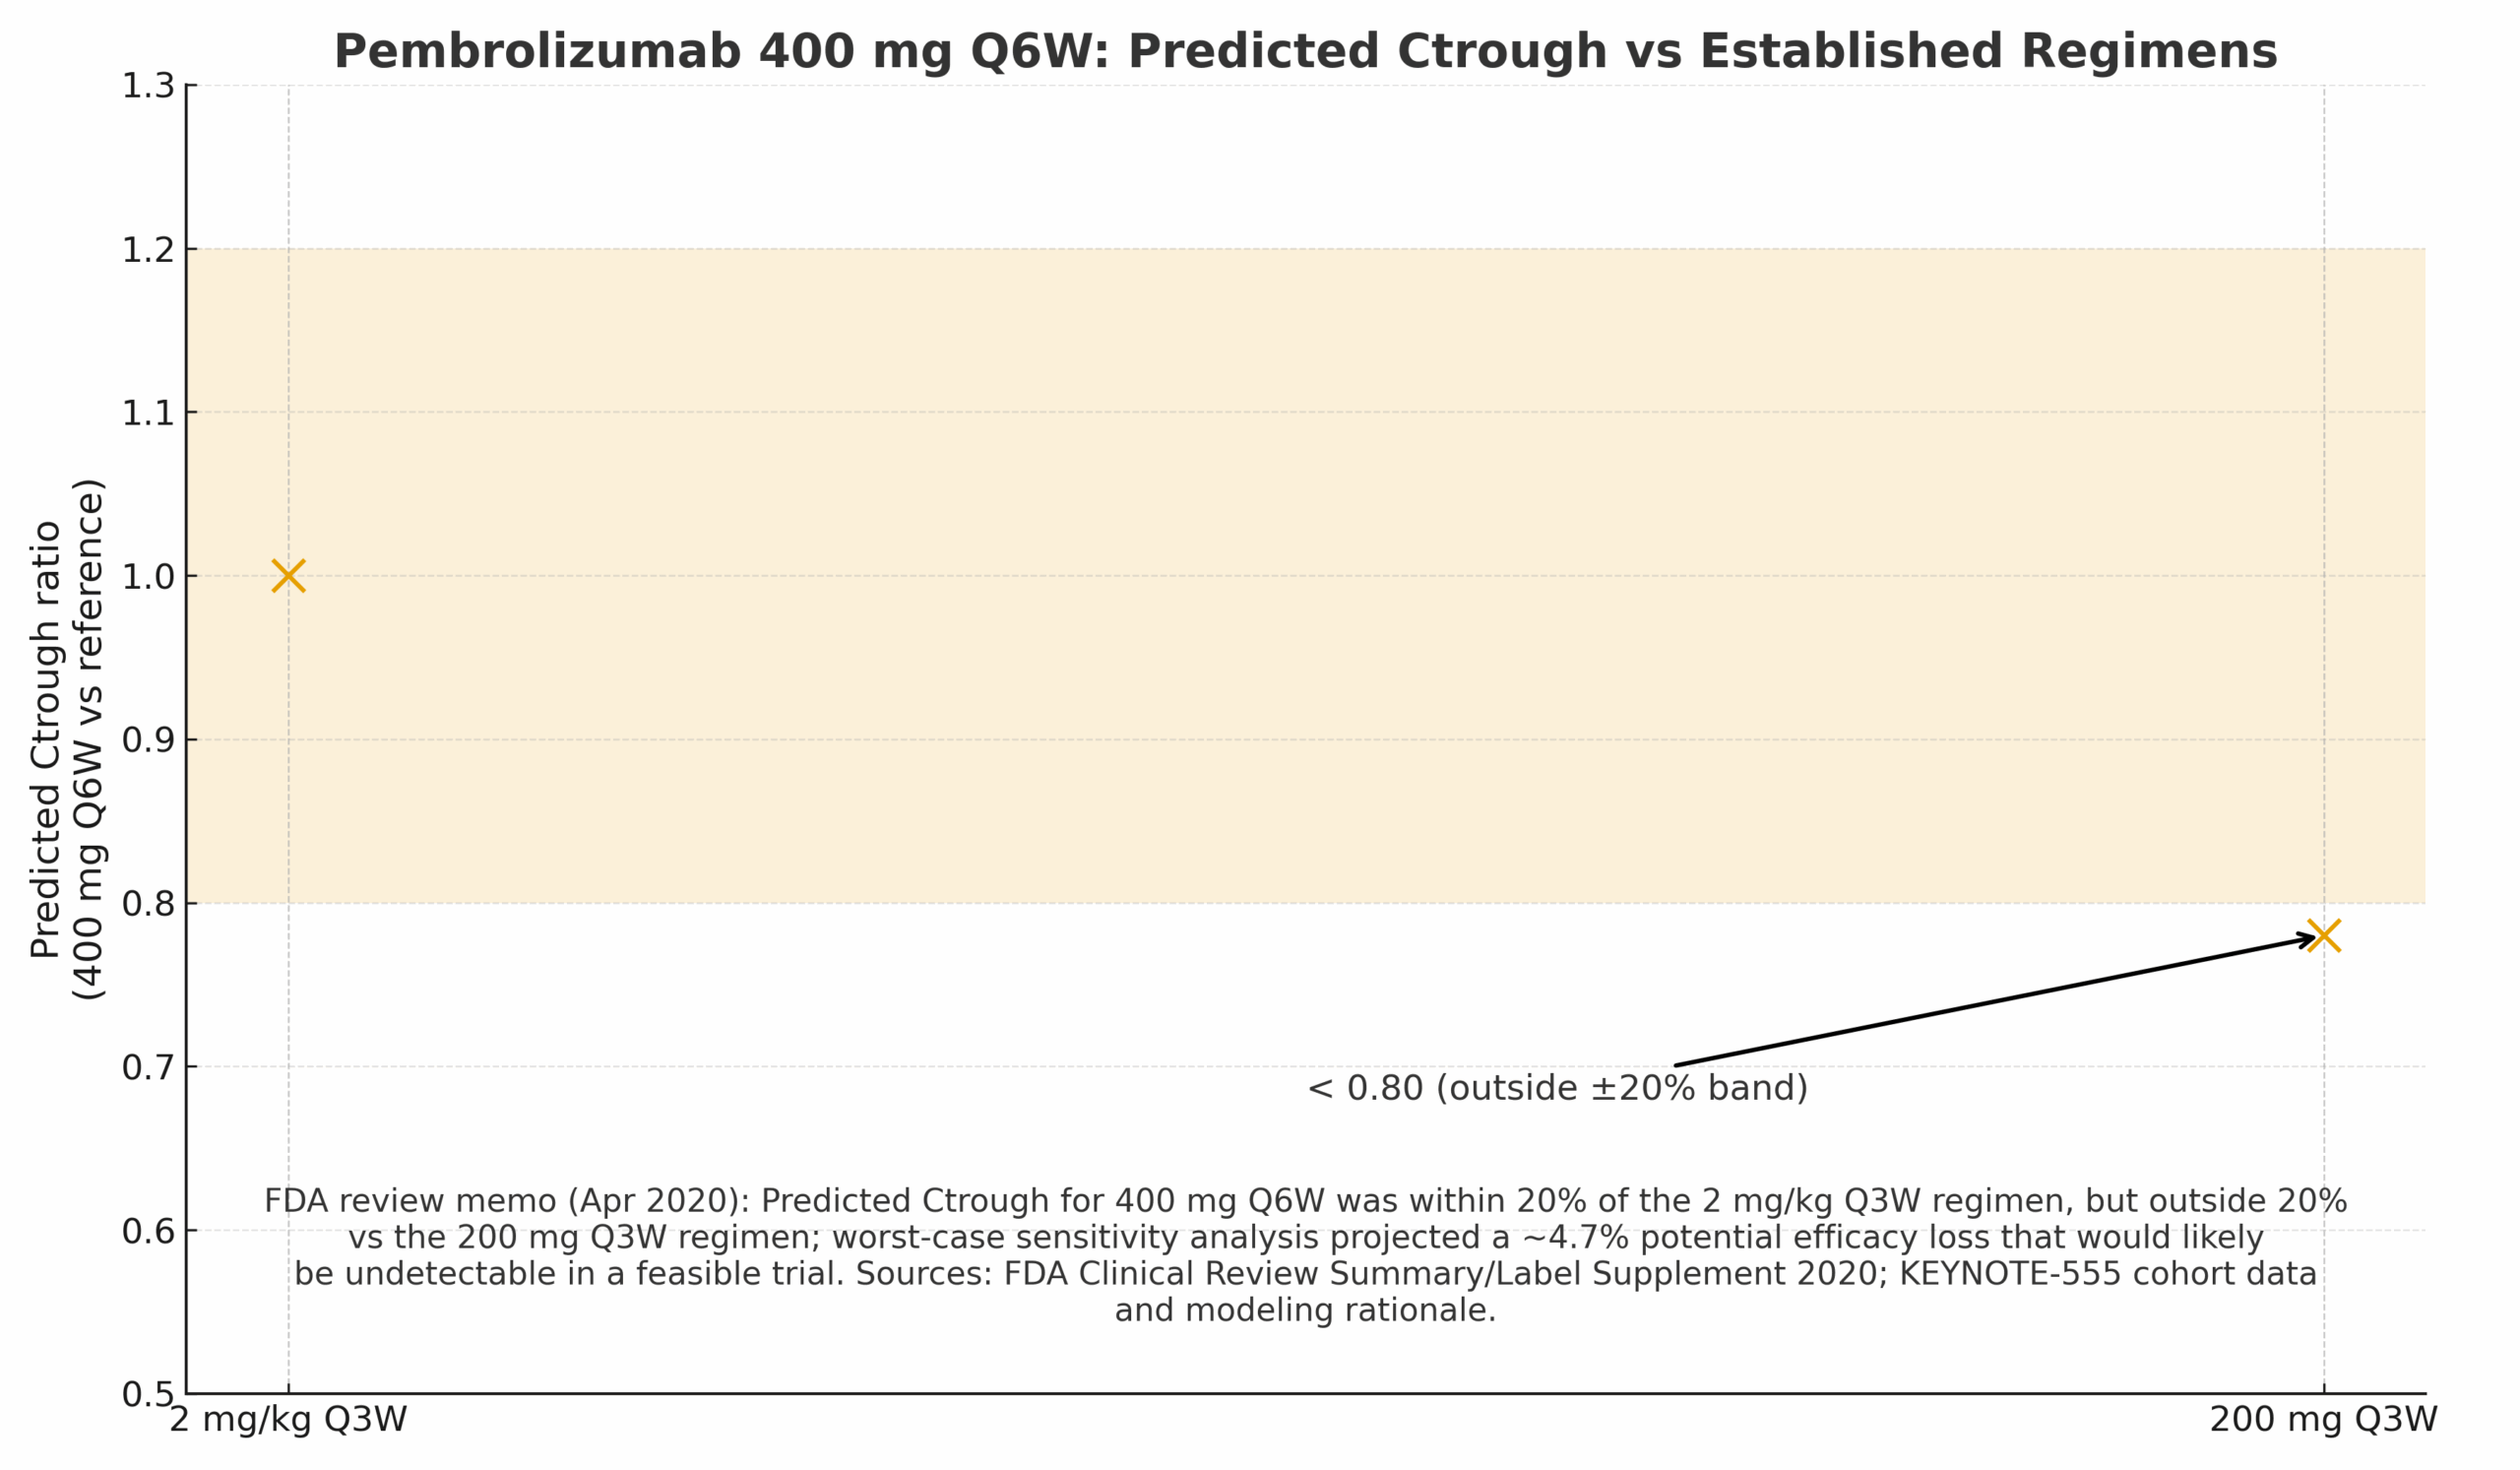
Regulatory/Label Impact
FDA accepted the Q6W regimen across adult indications (2020) via exposure bridging—no new efficacy trial required.
Case 2 — “Flat” Exposure–Response (Efficacy & Safety) Supports Fixed Dose
Problem
Can a flat E–R relationship support moving from weight-based 3 mg/kg Q2W to fixed 480 mg Q4W while maintaining efficacy and safety?
Modeling Approach
- PopPK predictions of Cavg,ss/Cmin,ss for 480 mg Q4W vs 3 mg/kg Q2W.
- E–R datasets showing stable ORR across exposure quartiles and no upward trend in Grade ≥3 AEs at clinical exposures.
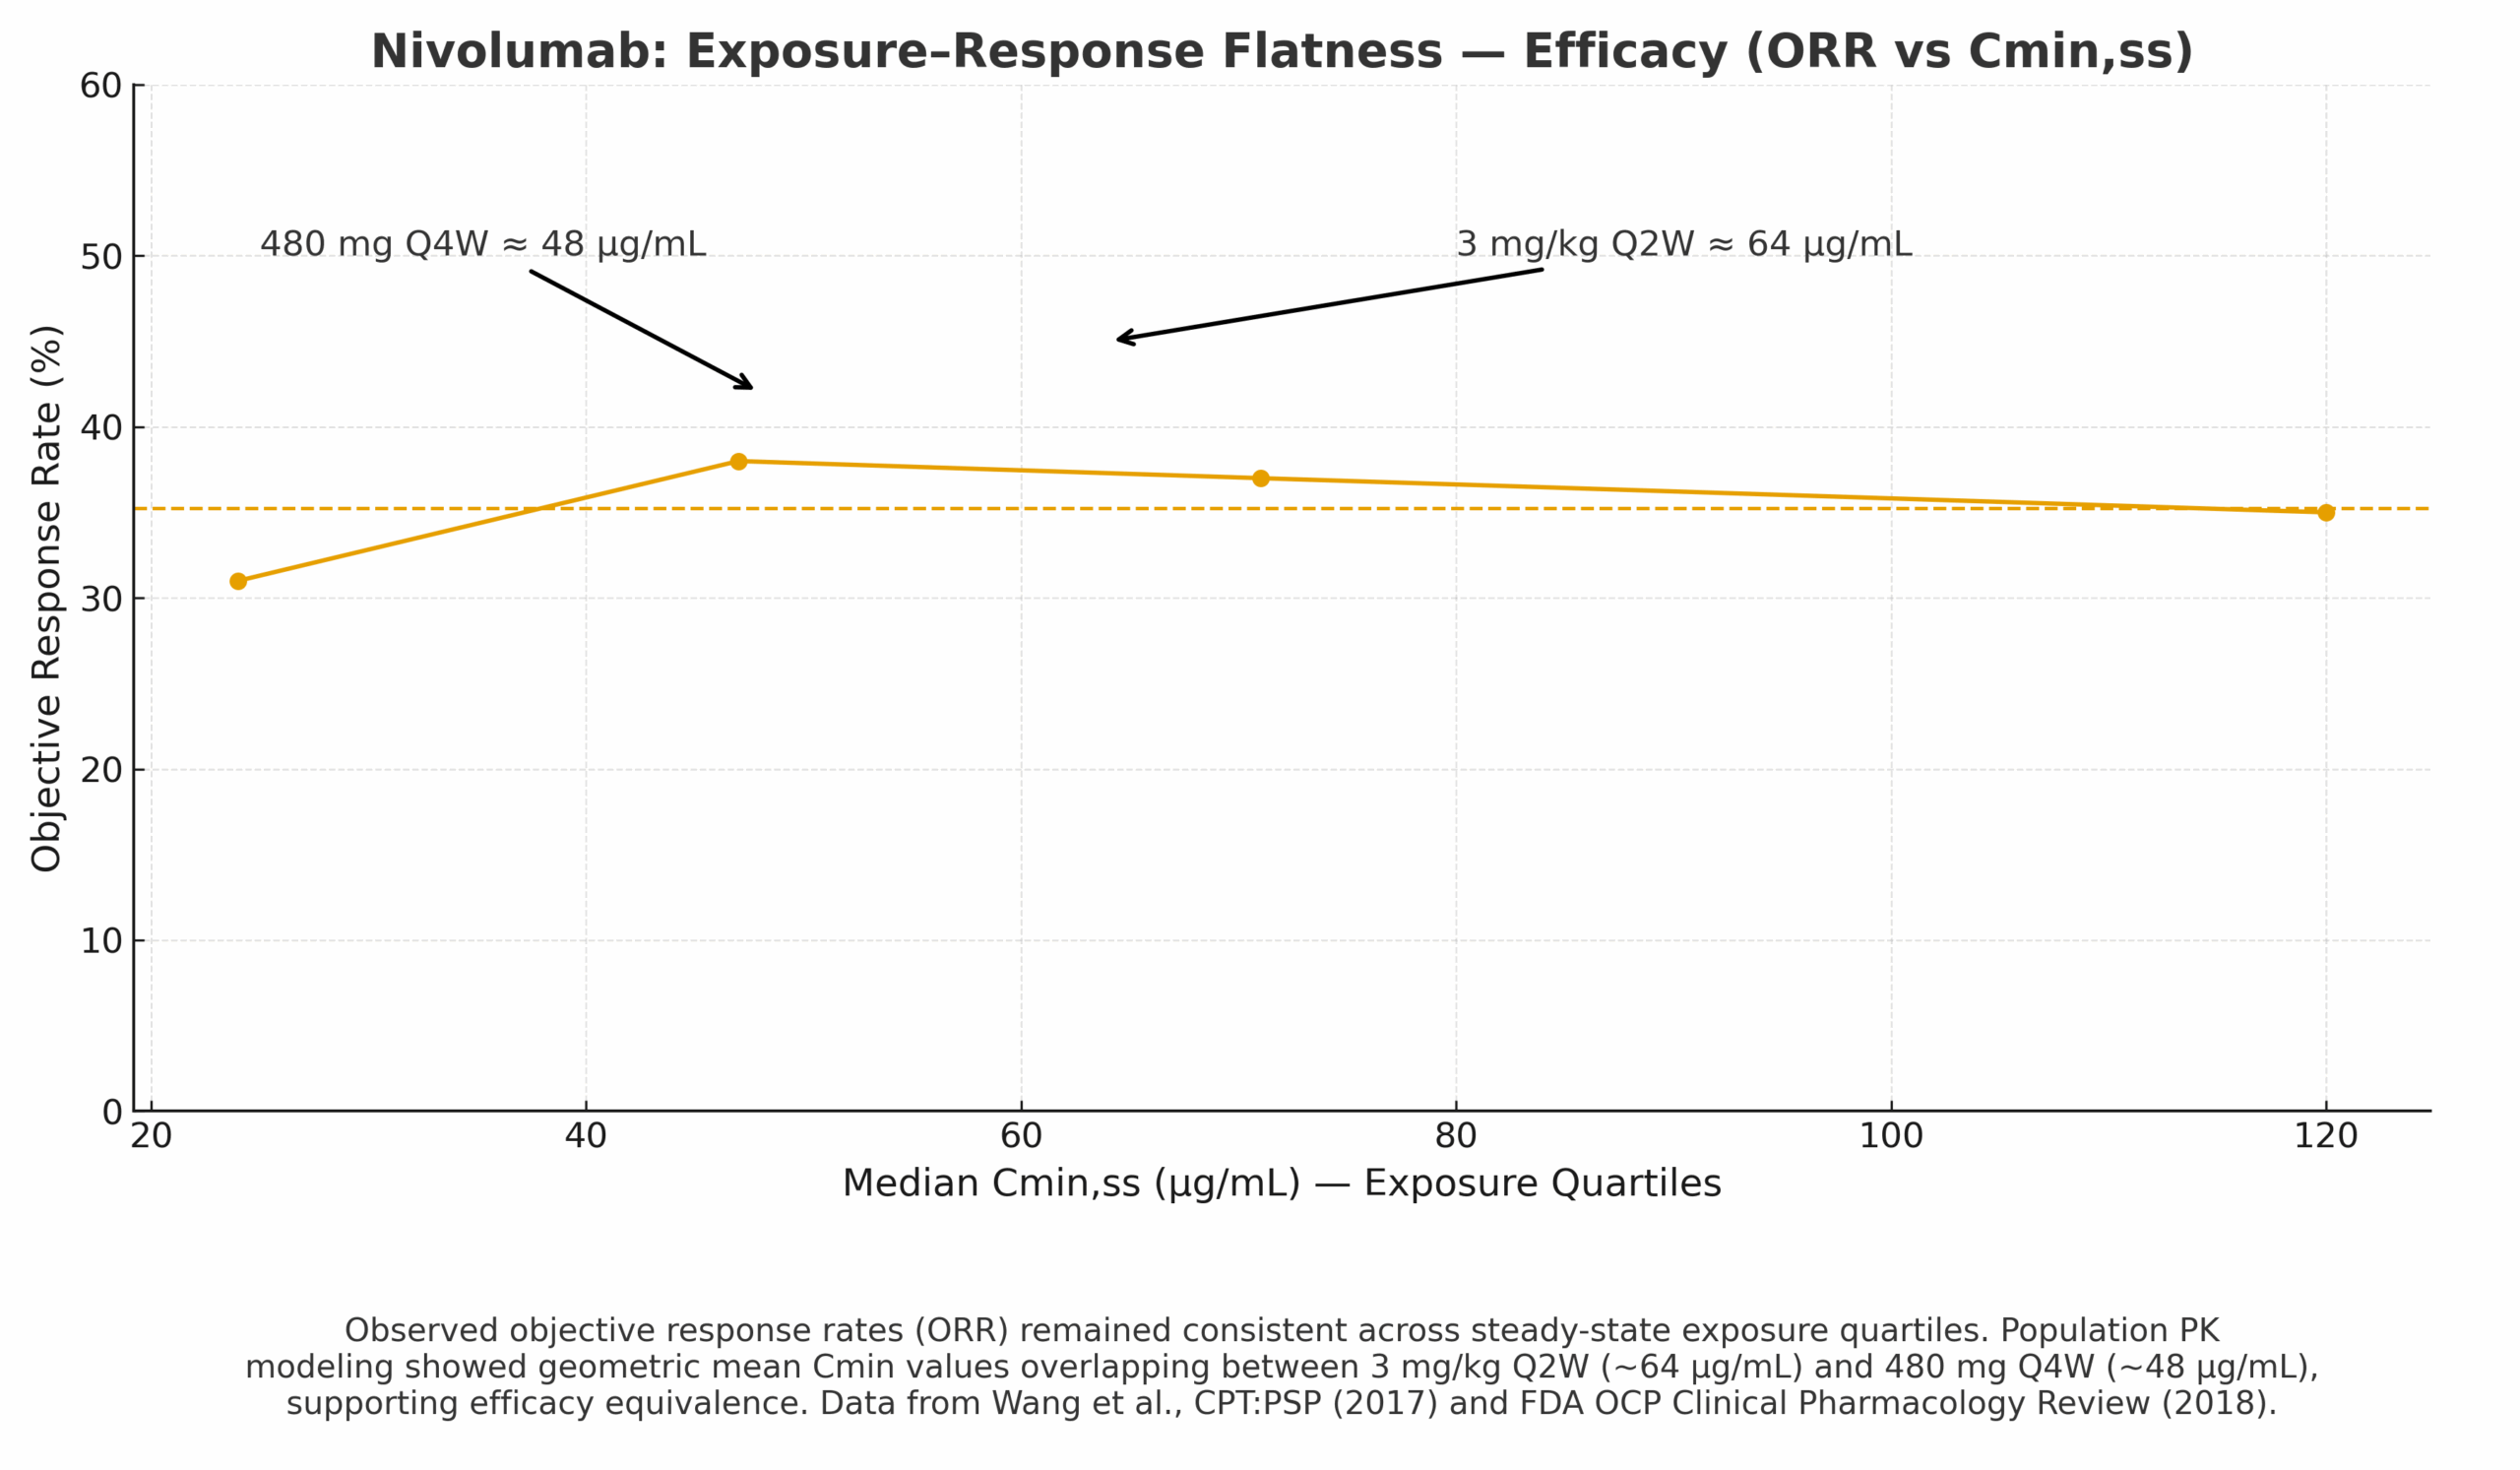
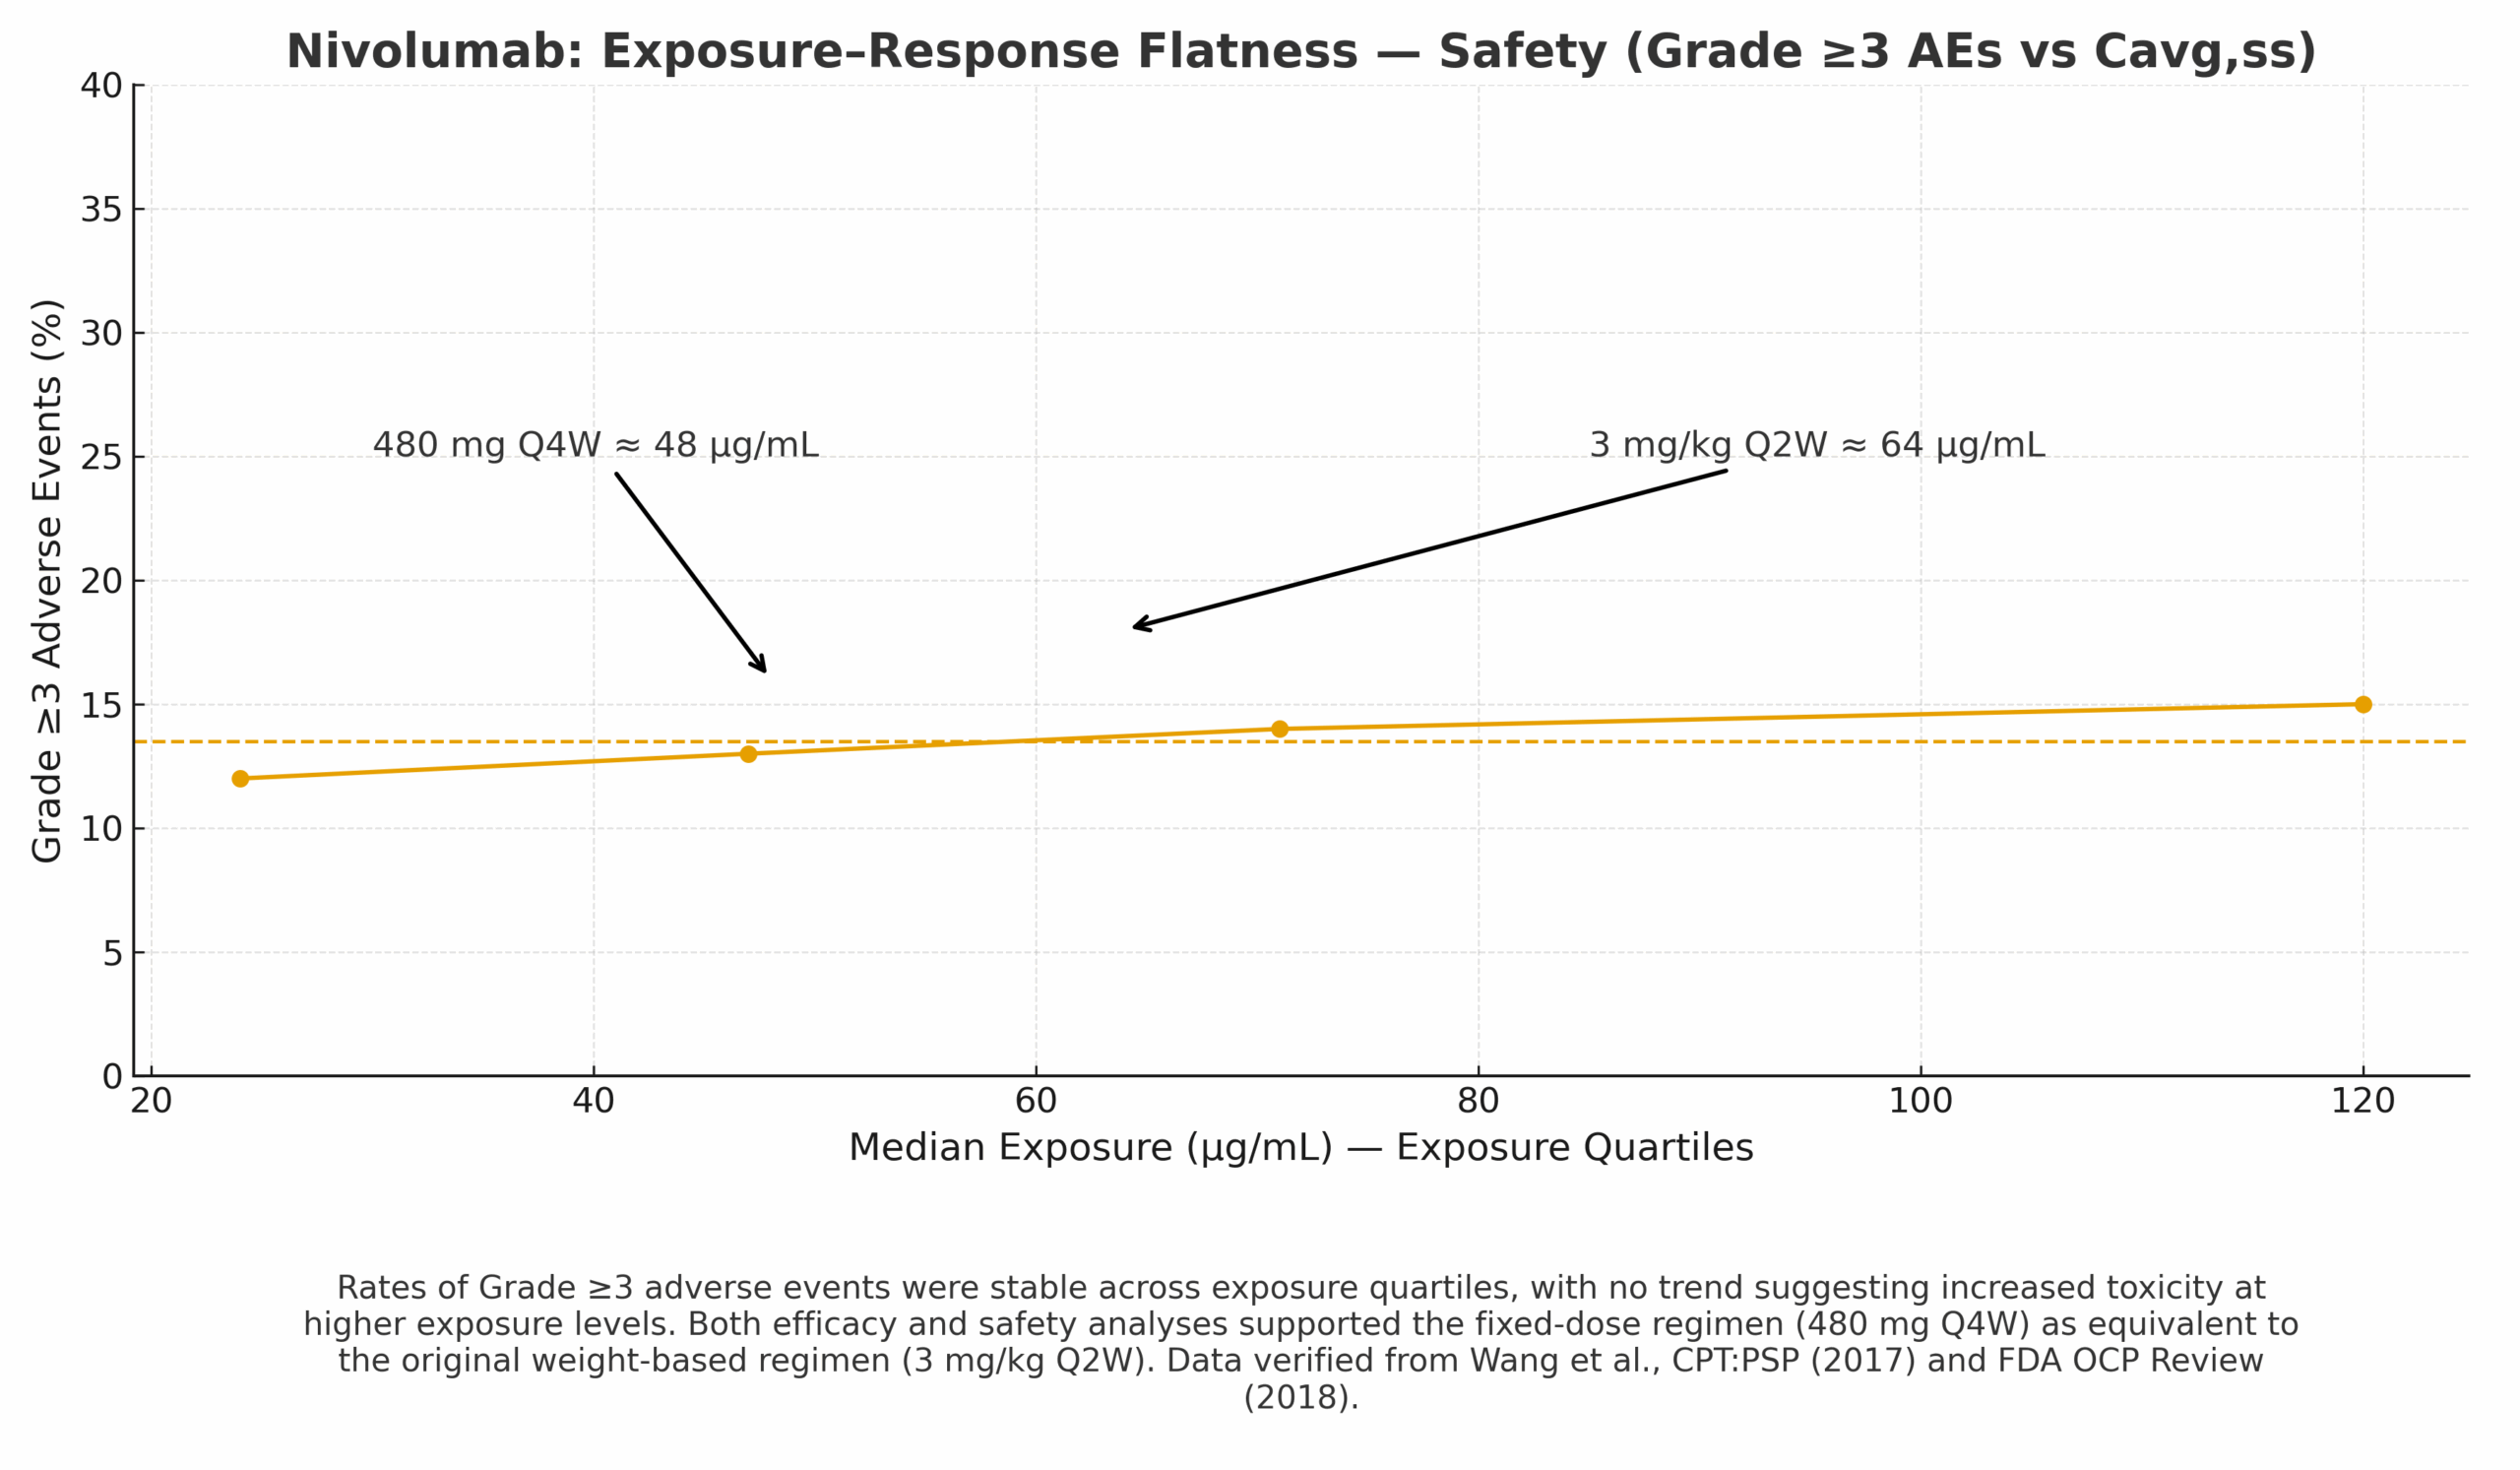
Regulatory/Label Impact
FDA accepted 480 mg Q4W as an alternative regimen based on PopPK bridging and flat E–R.
Case 3 — PBPK Verification for CYP3A DDI Labeling (Ibrutinib)
Problem
Predict effects of CYP3A inhibitors/inducers on ibrutinib exposure without running every clinical DDI.
Modeling Approach
- PBPK platform verified vs clinical DDI(s); KPI accuracy bands (≤1.25×, ≤2×).
- Simulations across strong/moderate/weak inhibitors and a strong inducer.
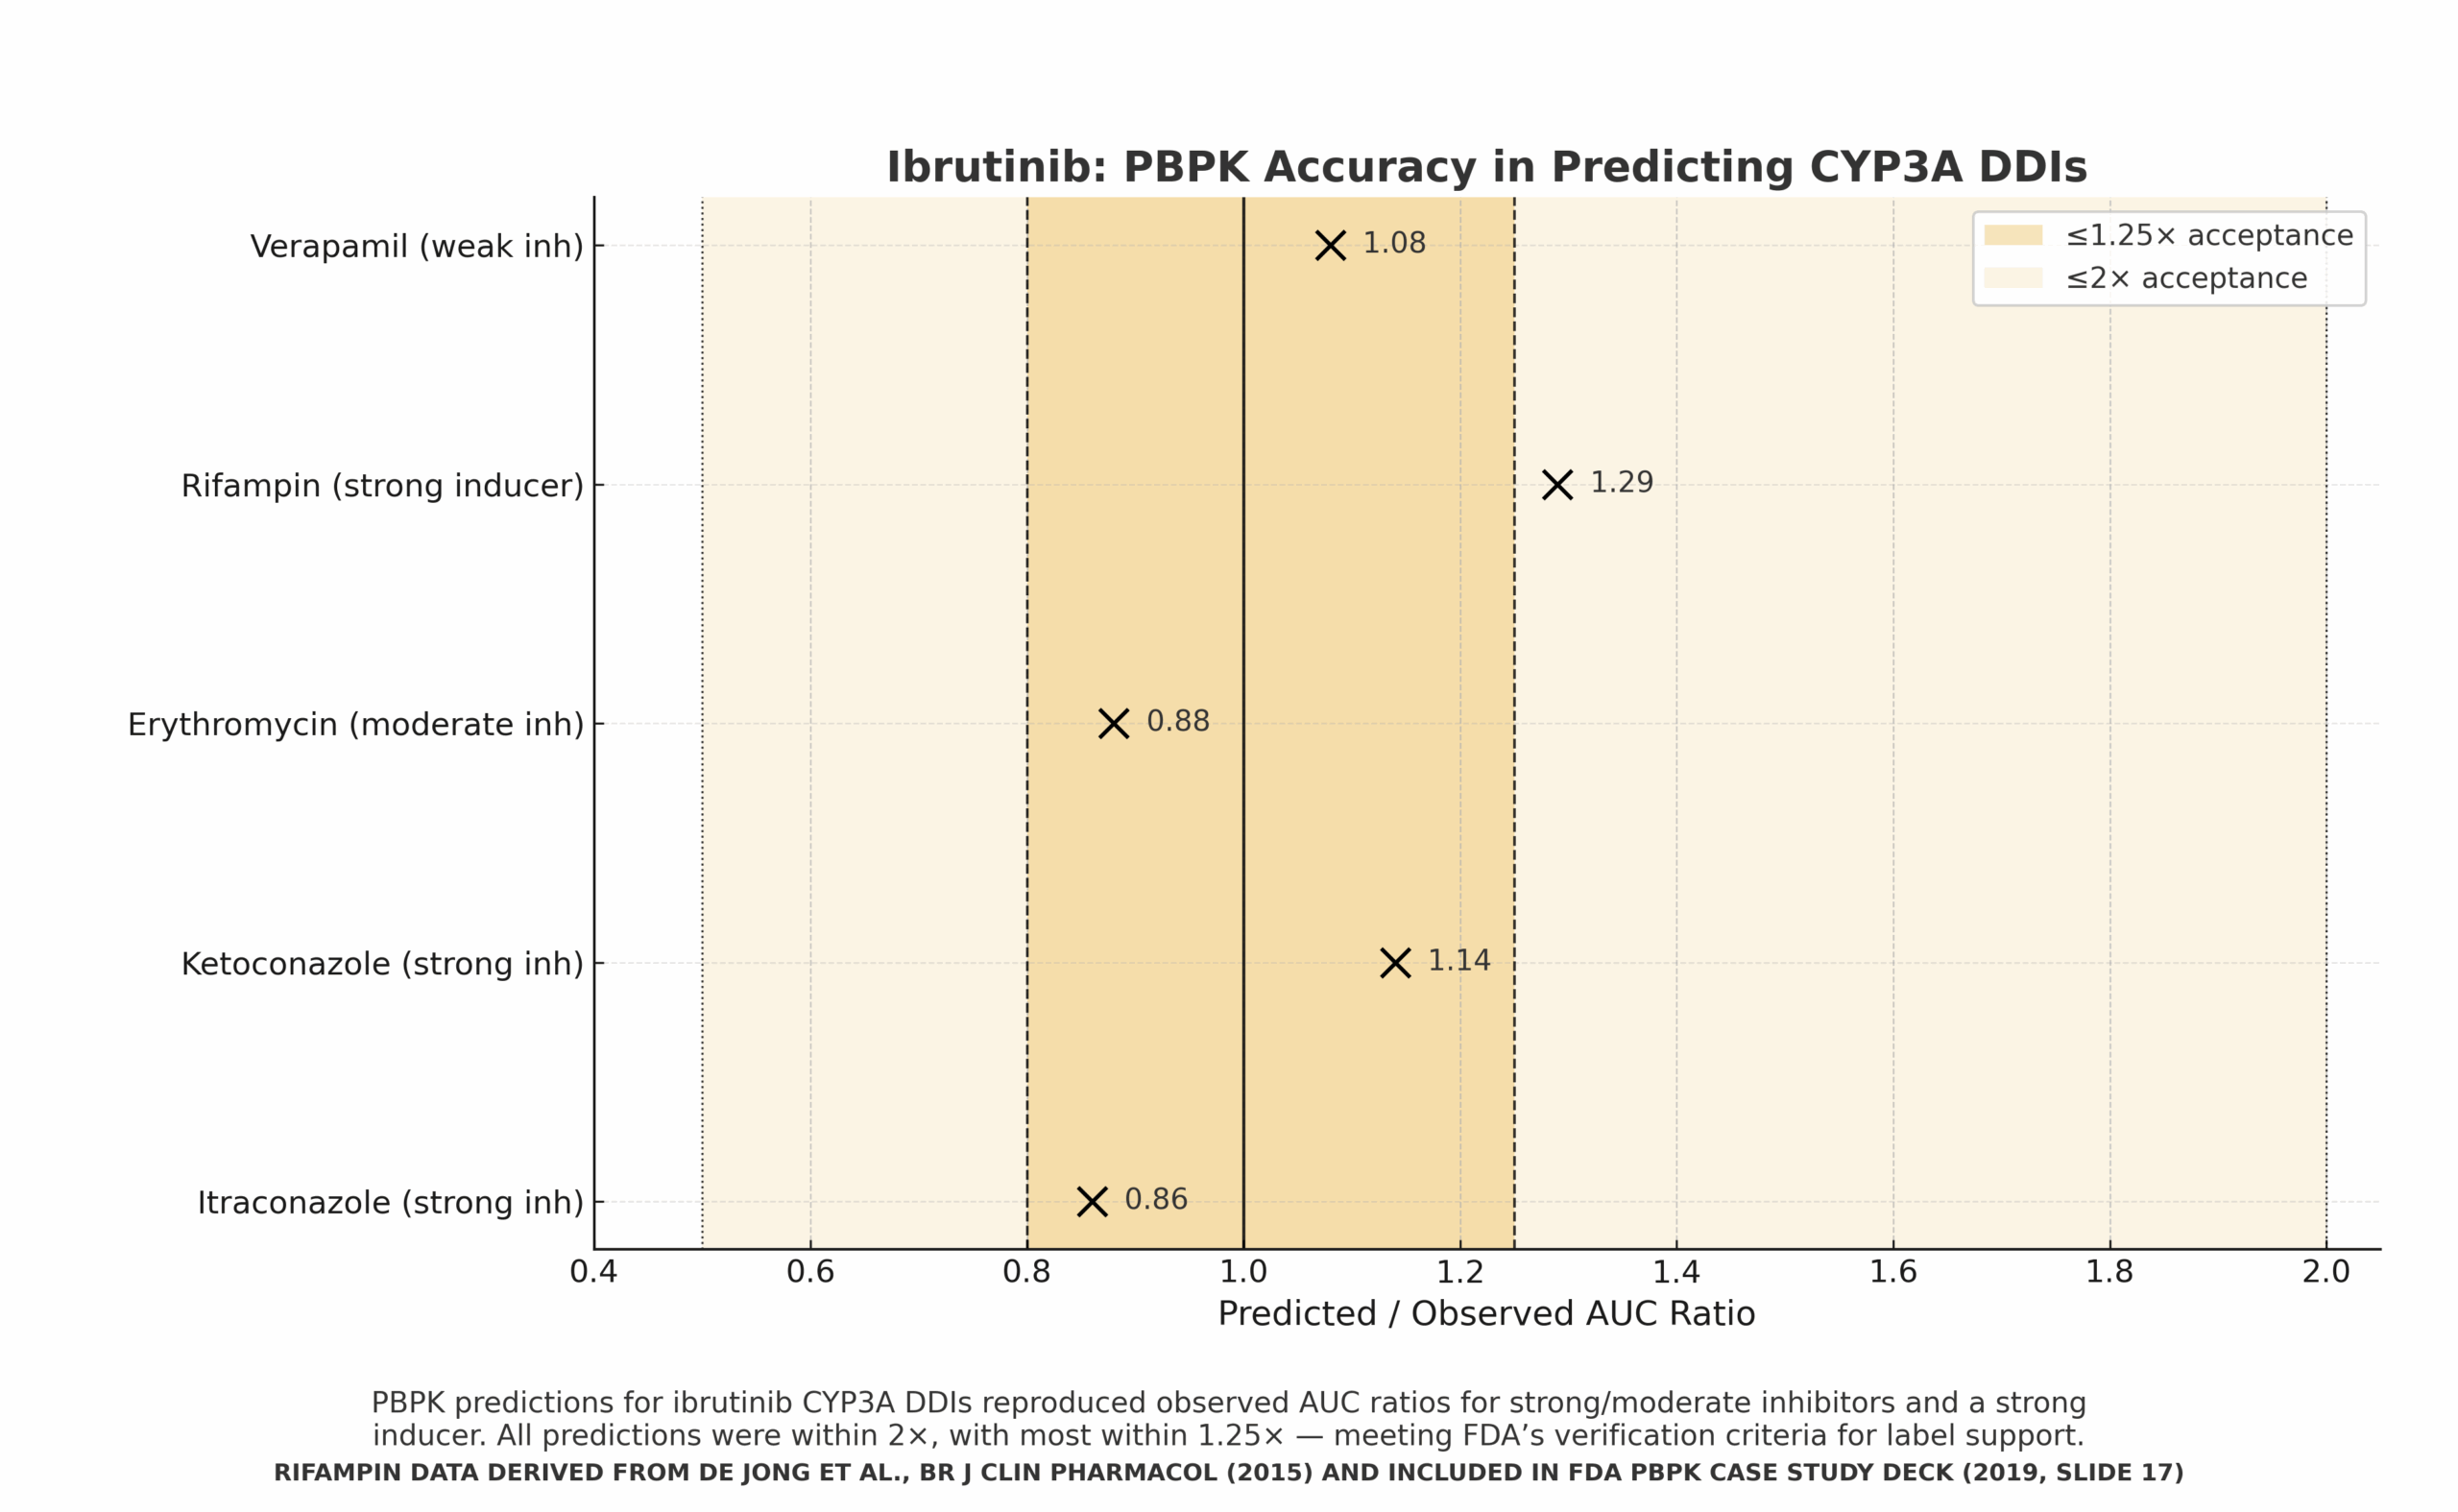
Regulatory/Label Impact
Supported labeling/dosing recommendations for inhibitor/inducer scenarios once verification criteria were met.
Case 4 — Pediatric PBPK & Age-Appropriate Dosing (Voriconazole)
Problem
Children exhibit age-dependent exposure due to CYP2C19 ontogeny; traditional trials are sparse.
Modeling Approach
- Pediatric PBPK translating adult data to age/weight-appropriate doses.
- Verification vs observed AUC with an adult target band (30–50 μg·h/mL).
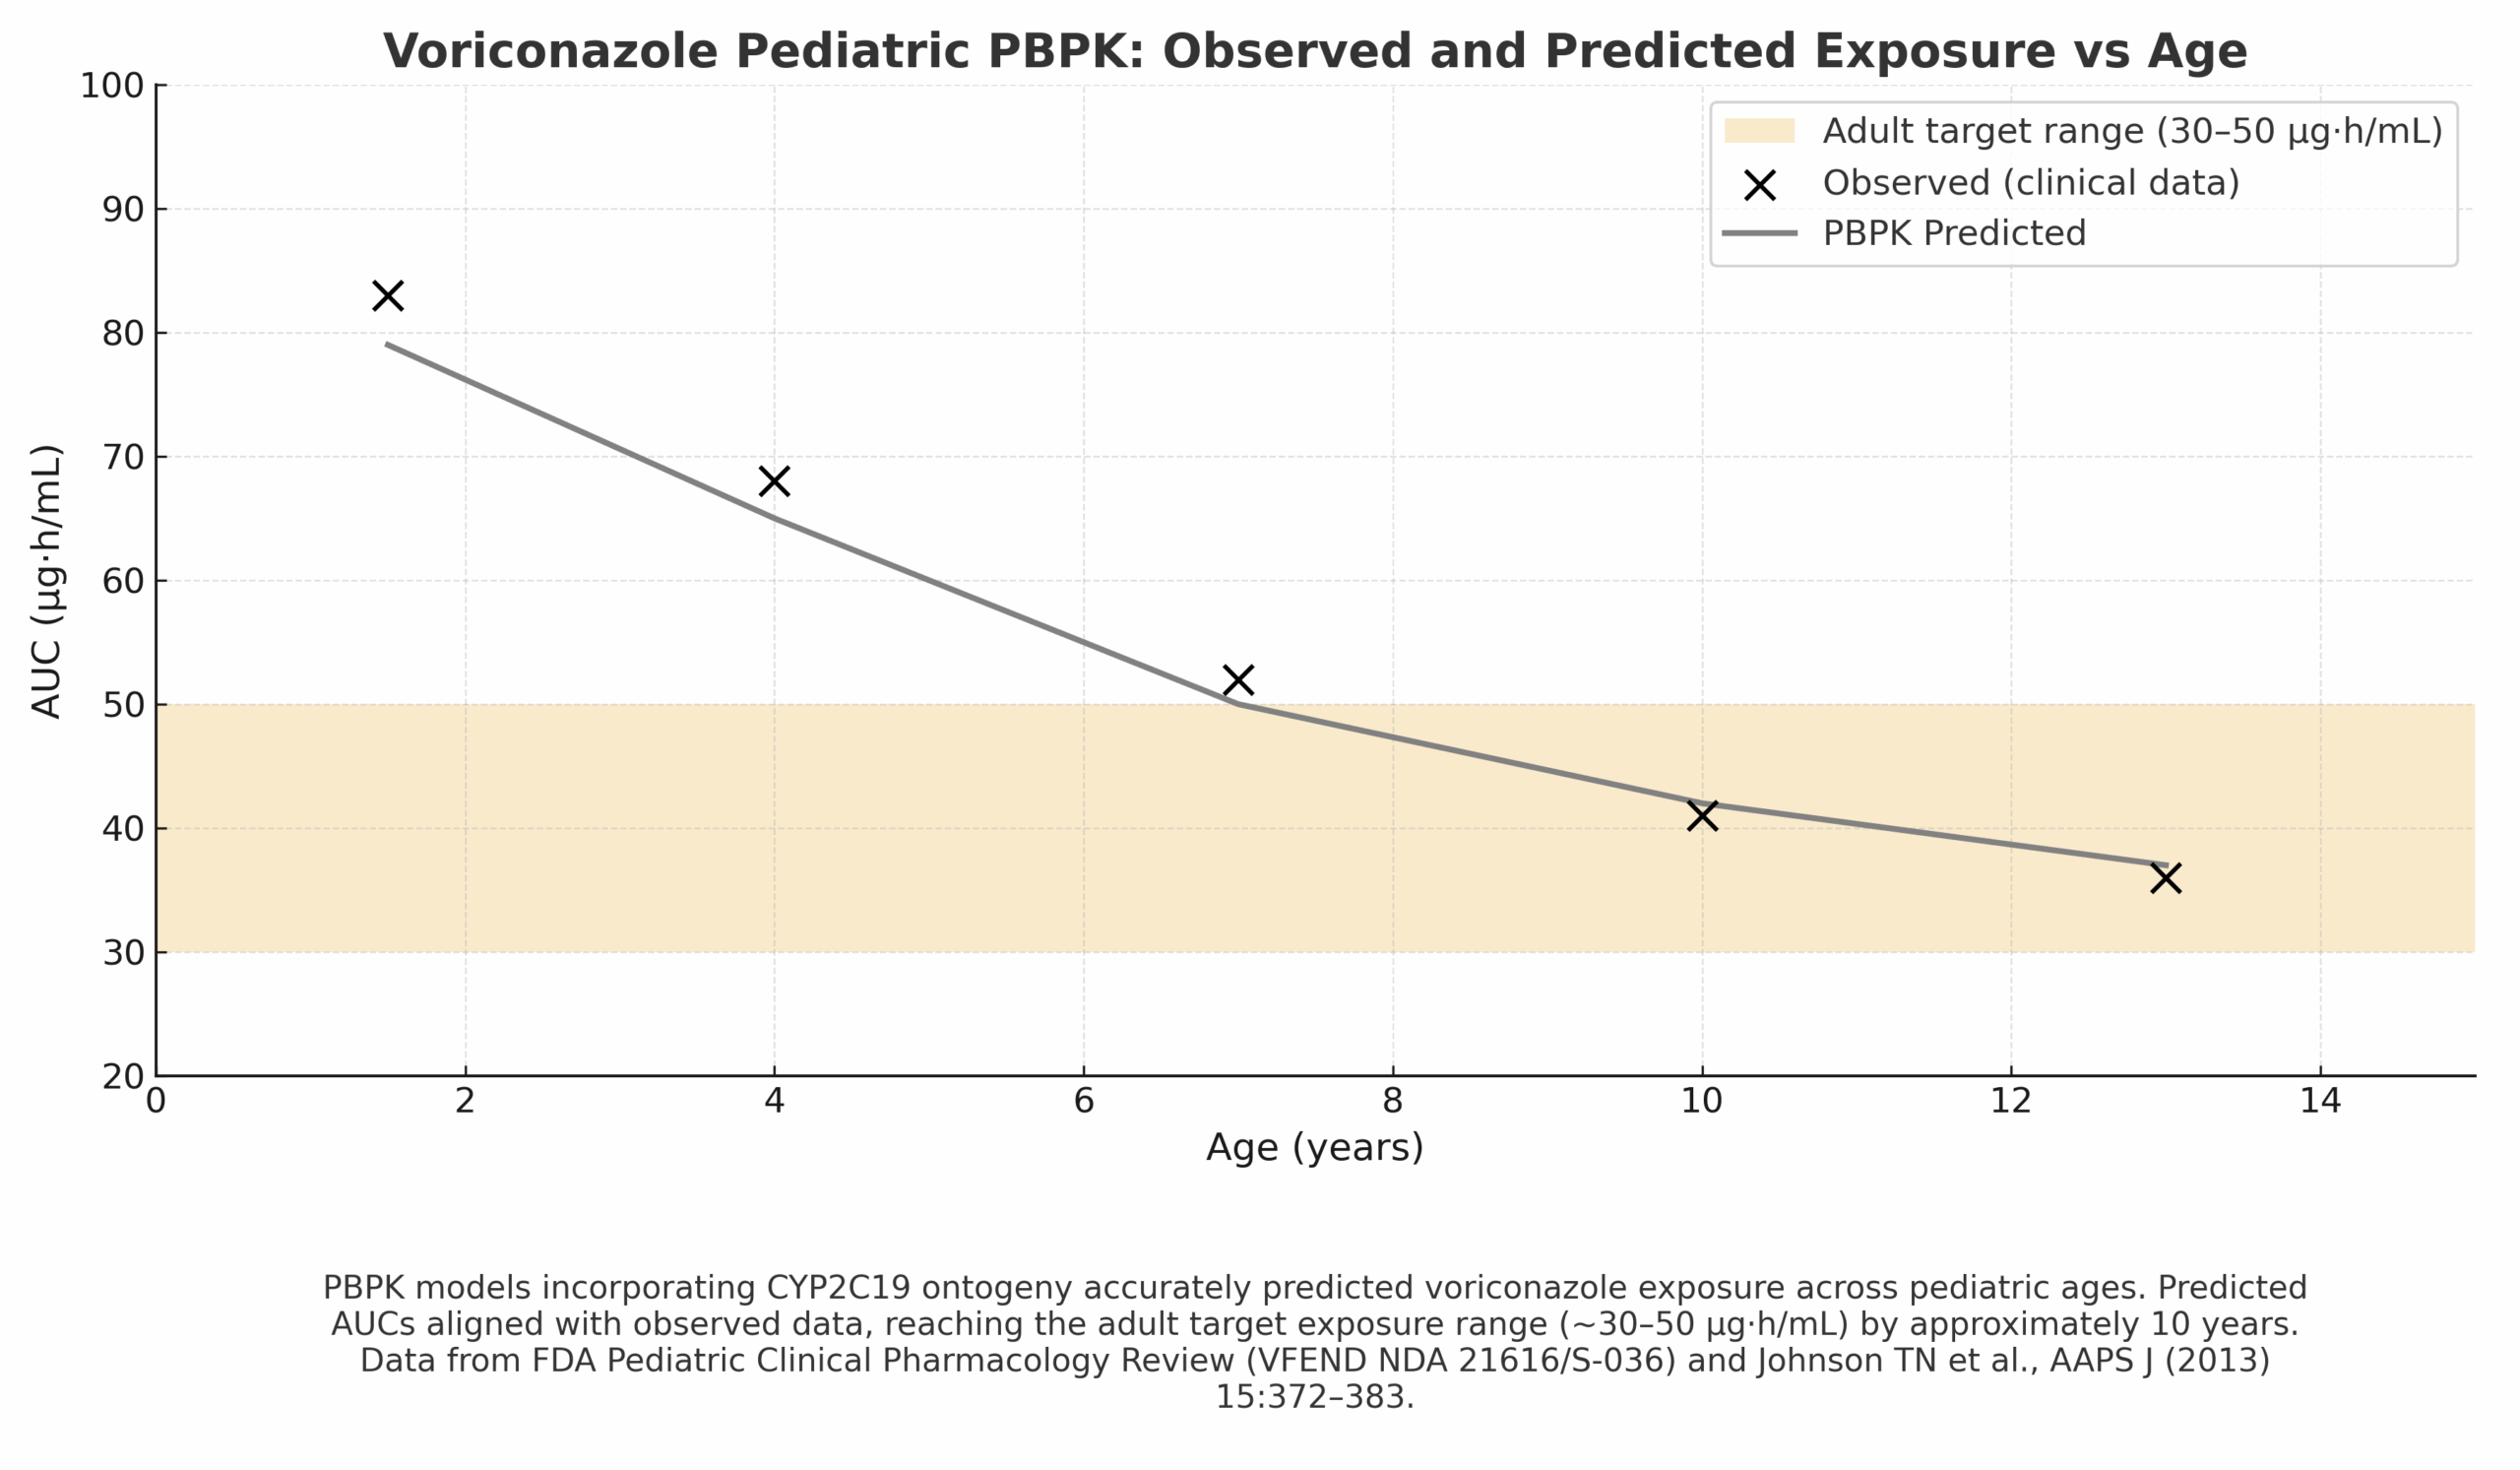
Regulatory/Label Impact
Informed pediatric dosing bands and labeling; often paired with TDM where variability is high.
Case 5 — PBPK for Gastric Emptying Delay with GLP-1 Agonists
Problem
GLP-1 agonists slow gastric emptying, altering oral co-med Cmax and Tmax. Exhaustive FE/interaction studies for all co-meds are impractical.
Modeling Approach
- Mechanistic PBPK incorporating delayed gastric emptying half-time.
- Risk-based assessment for when simulations can replace or defer studies.
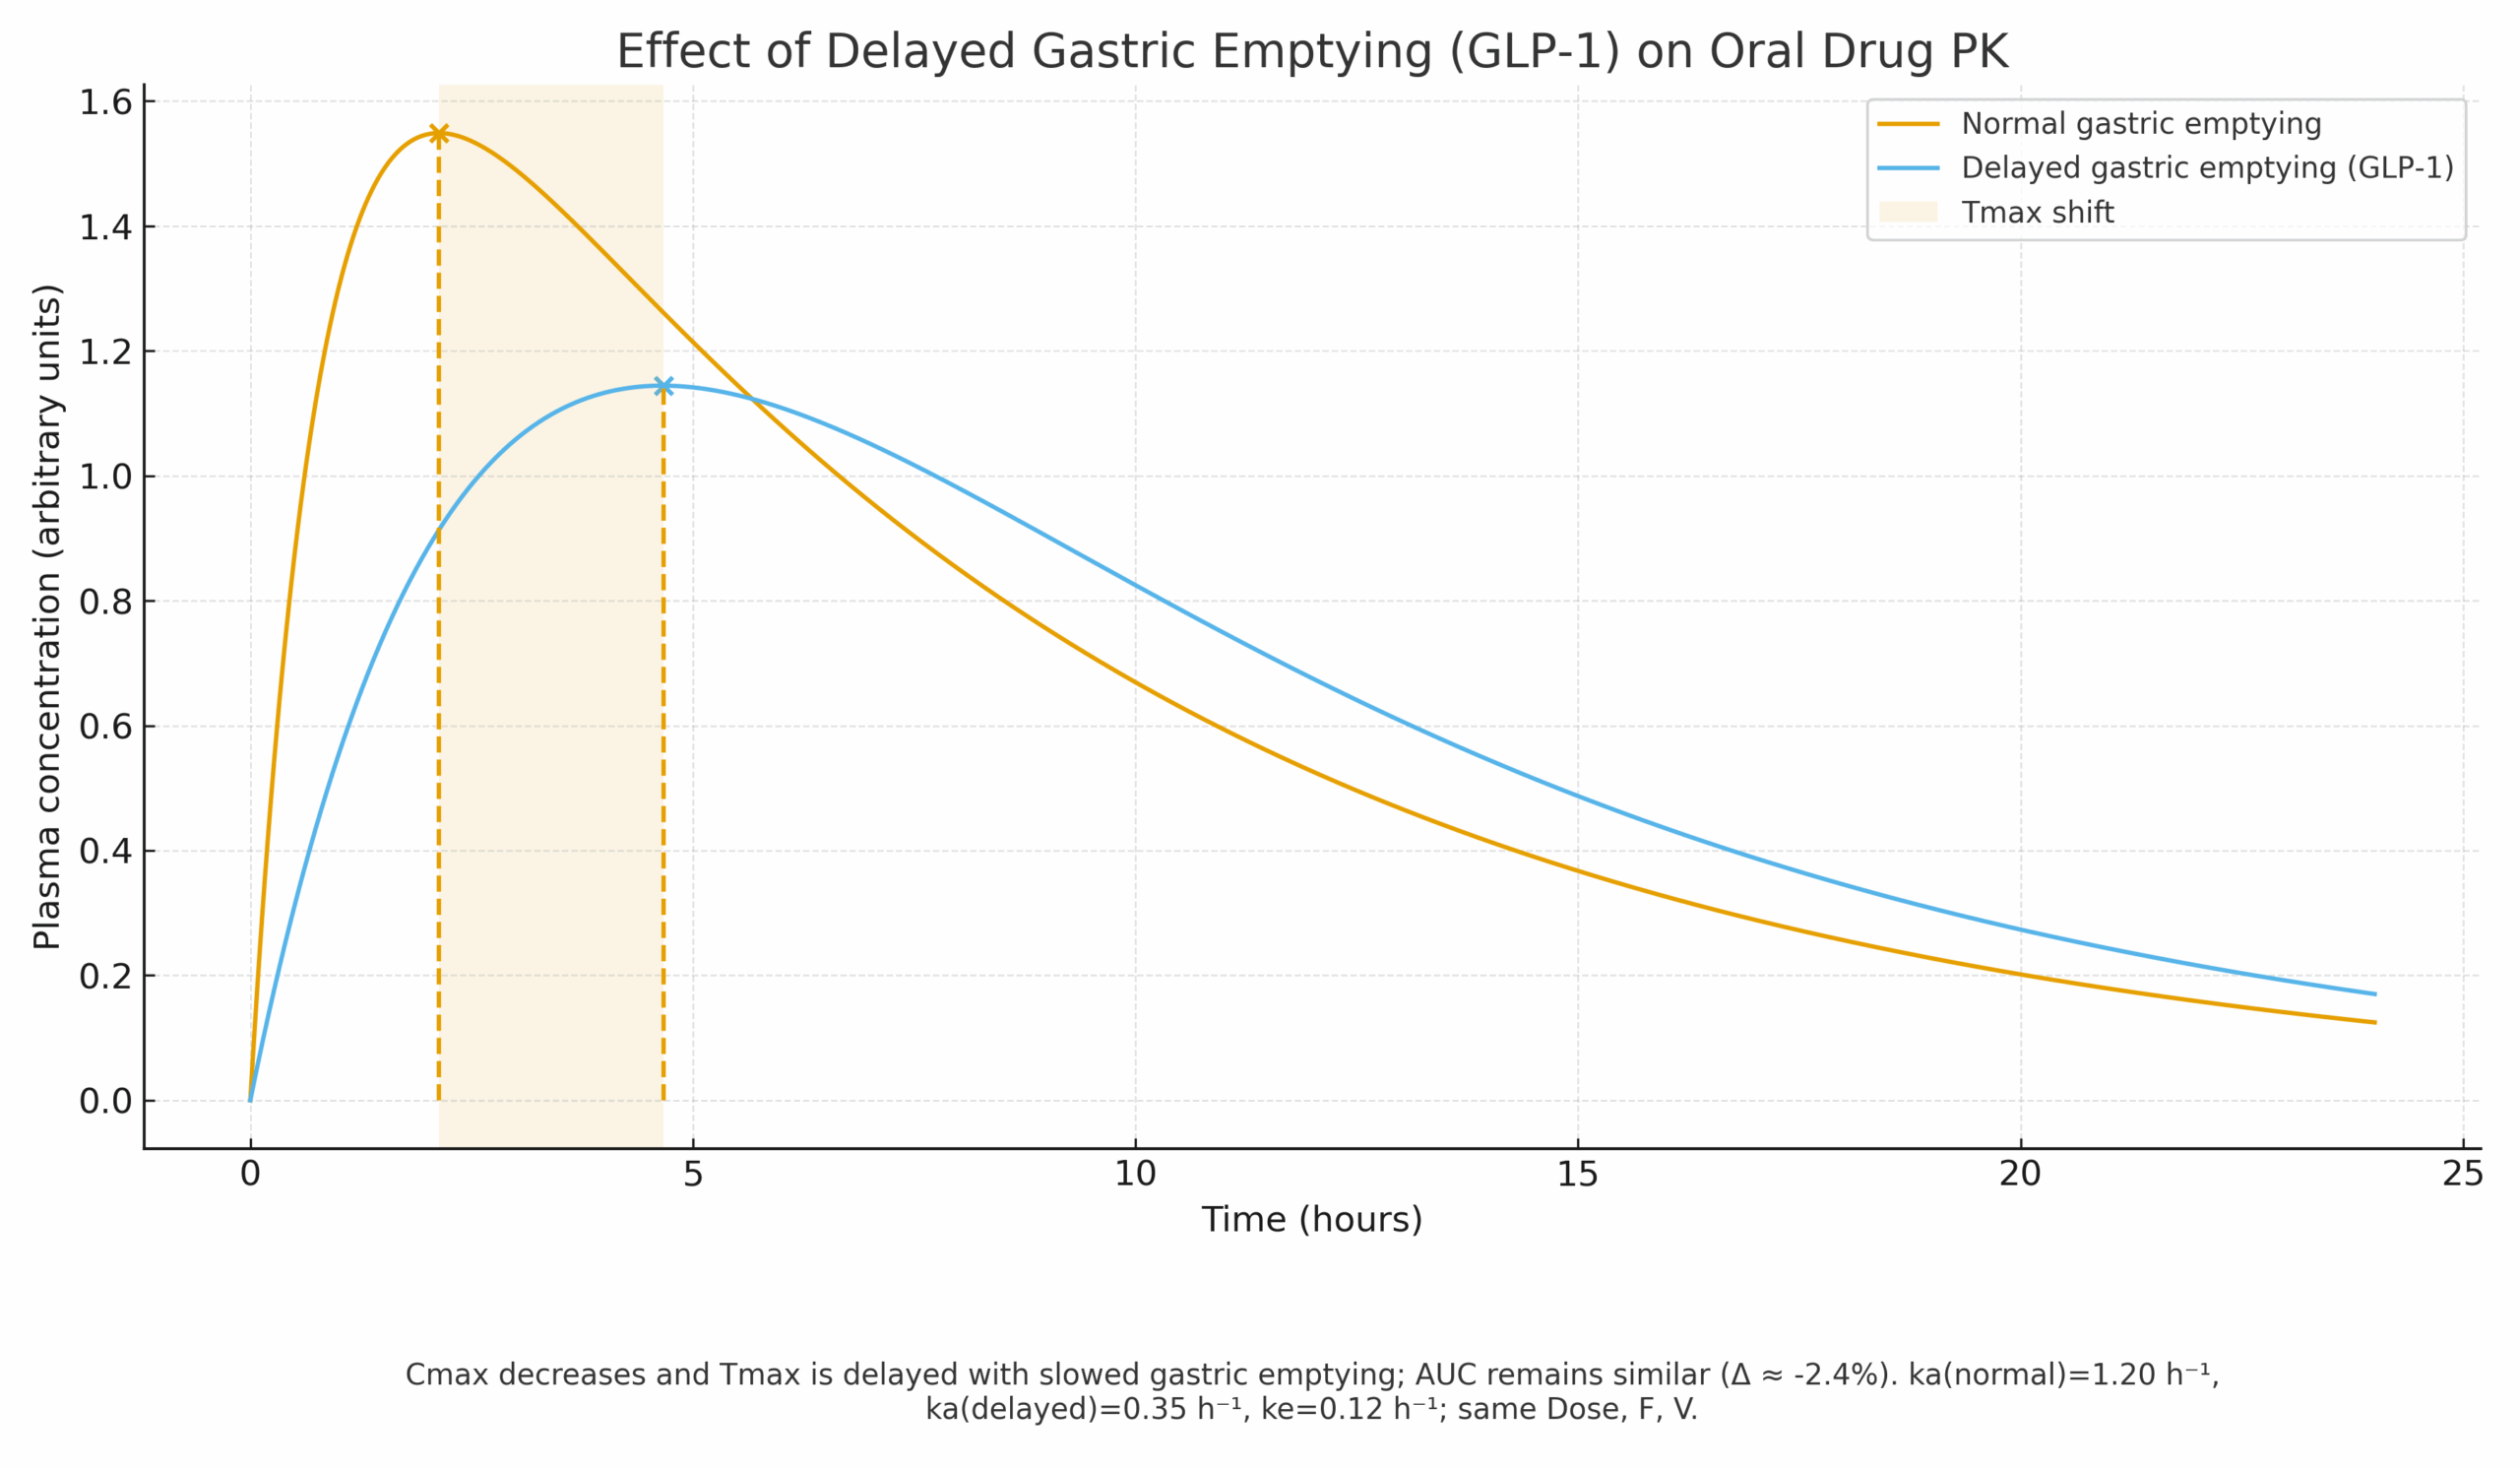
Regulatory/Label Impact
Provides a framework to triage FE/GET questions and support labeling language without exhaustive clinical matrices.
Case 6 — QSP for Serum/Urinary Calcium with rhPTH(1–84) (Natpara)
Problem
Optimize dosing to maintain serum calcium while reducing hypercalciuria risk—beyond what the trial explicitly evaluated.
Modeling Approach
- Mechanistic QSP of calcium–PTH homeostasis comparing standard vs alternative regimens.
- Decision readout: serum Ca in-range (8.0–9.5 mg/dL) and lower urinary Ca.
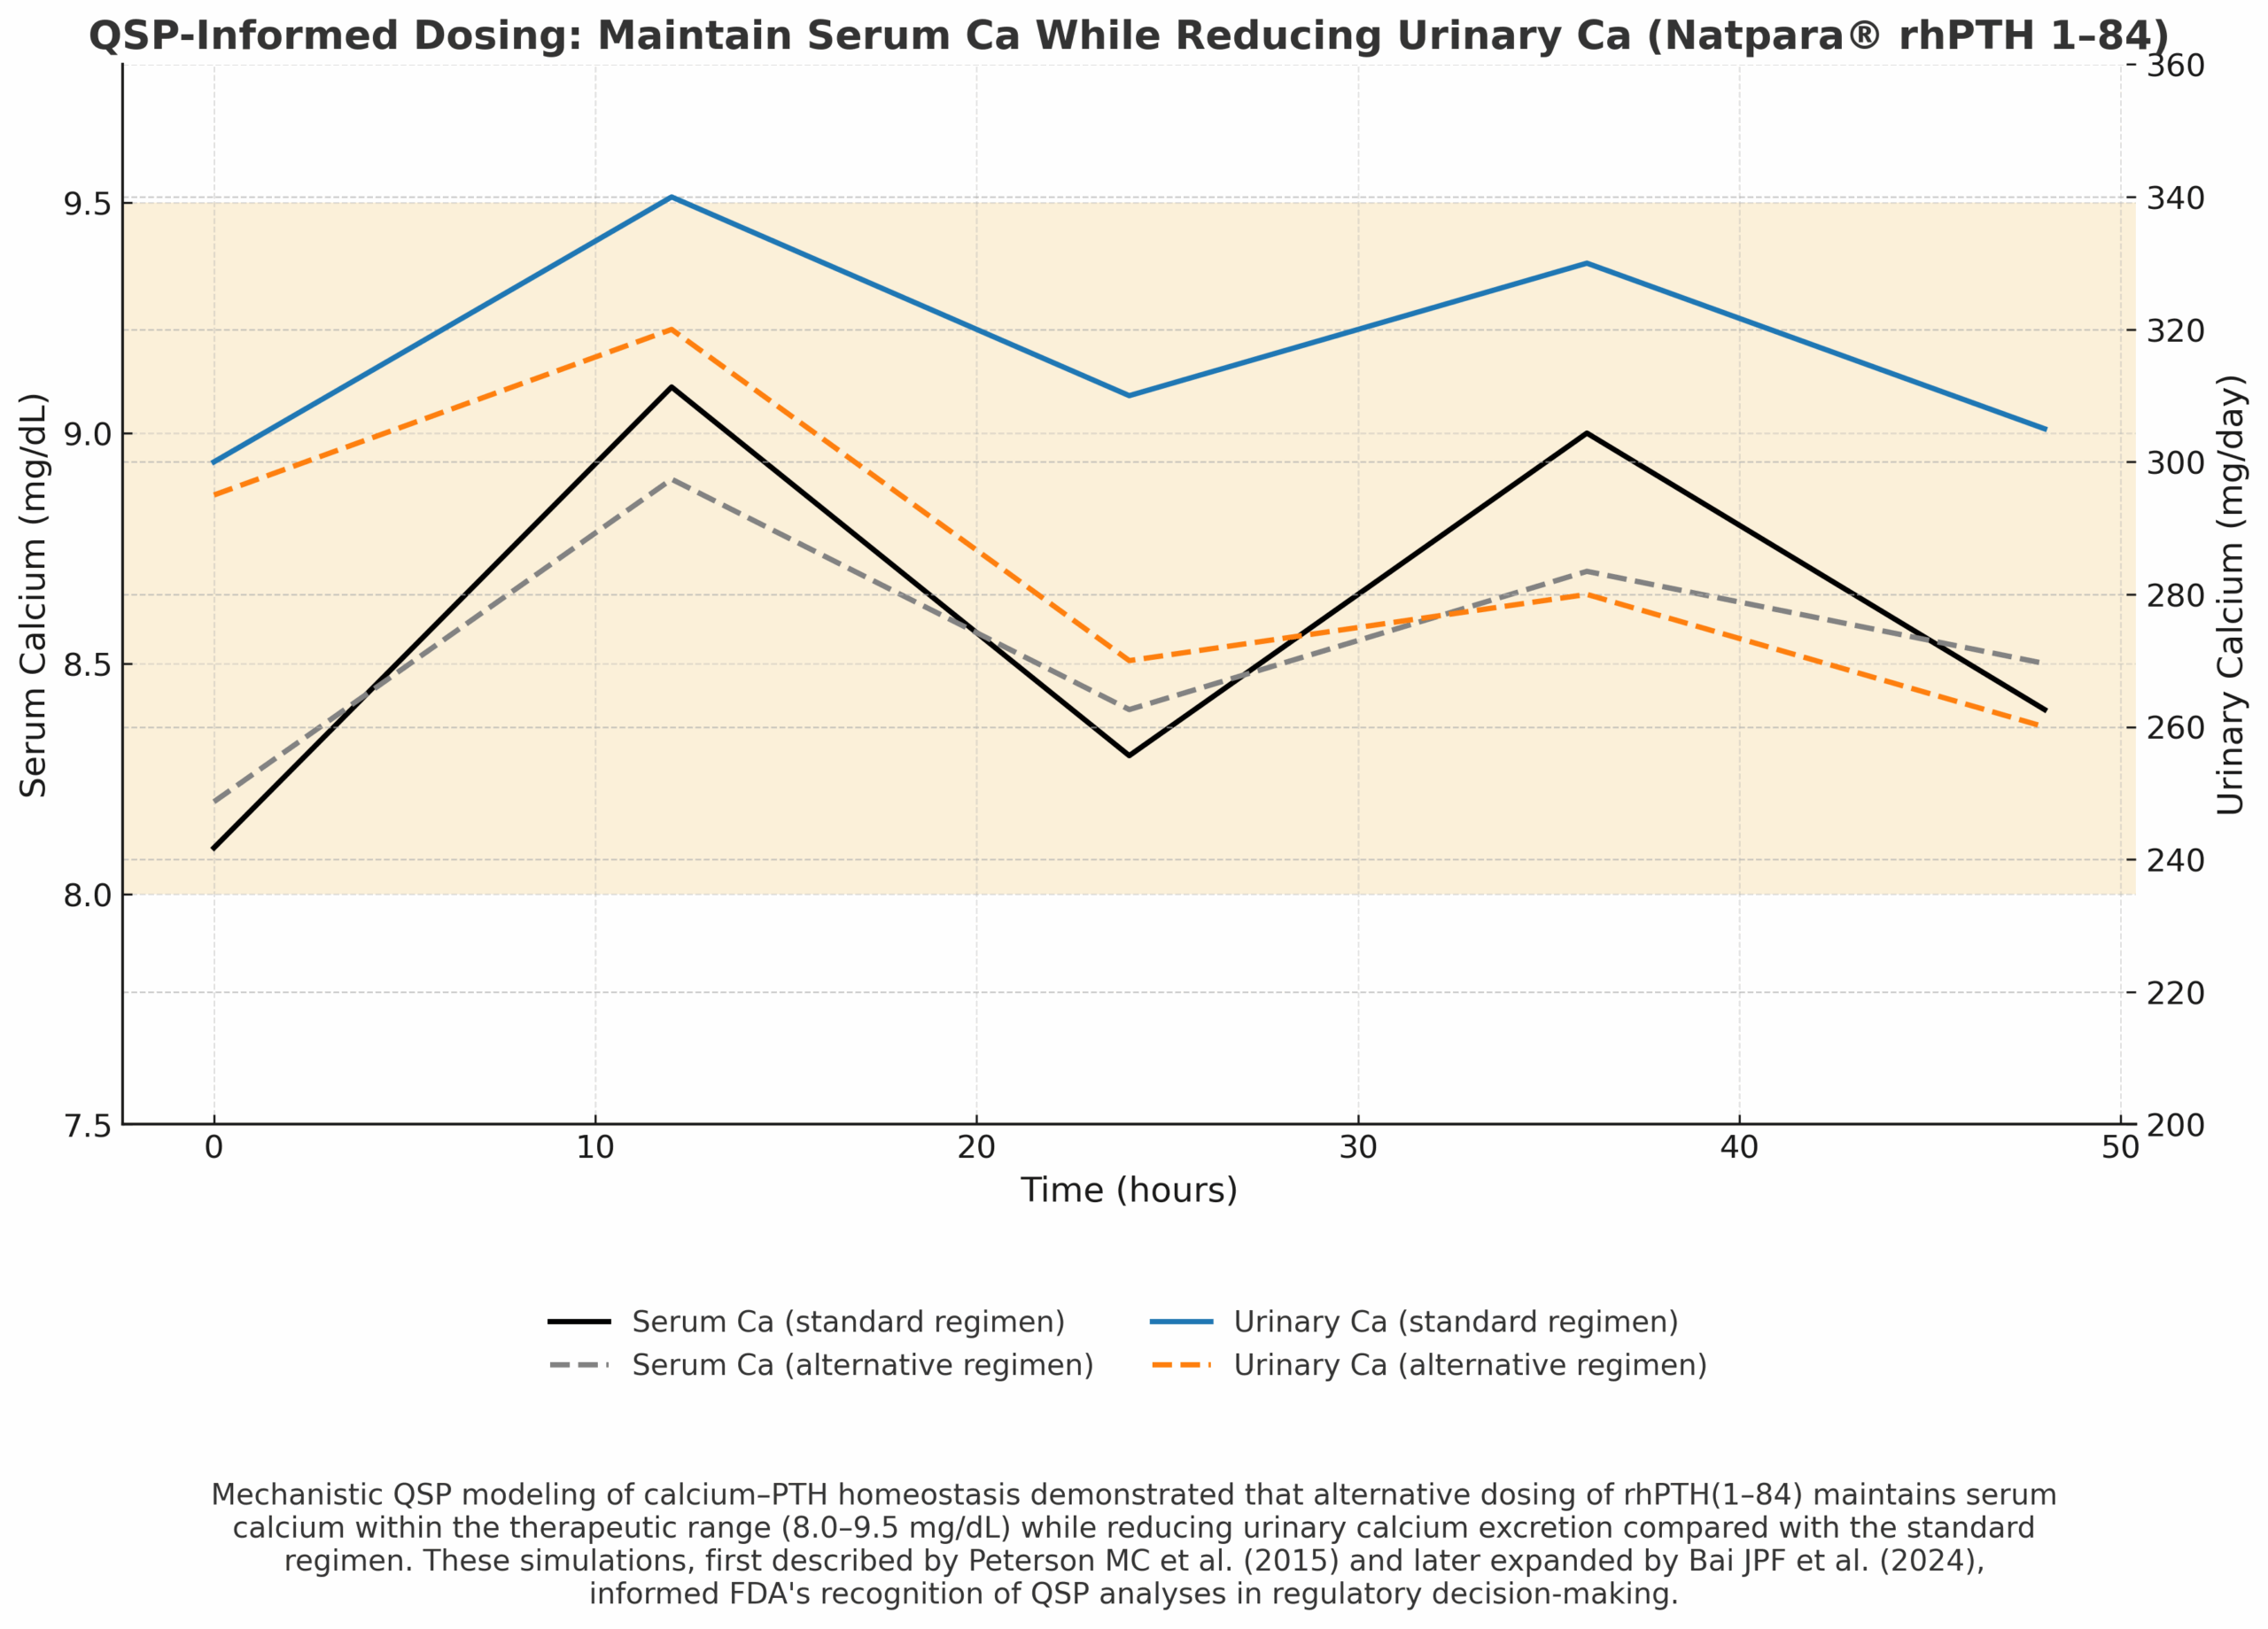
Regulatory/Label Impact
Widely cited as an early QSP example informing FDA decision-making and post-marketing requirements.
Summary & Practical Takeaways
- Start with the decision. Define the regulatory question narrowly; pick the simplest model that answers it.
- Verify for purpose. Use cross-checks (e.g., Pred/Obs bands for PBPK; GOF/VPCs for PopPK; sensitivity for QSP).
- Quantify uncertainty. Show how assumptions move the answer and whether conclusions are robust.
- Place results where reviewers expect them. Module 2.7.2 for Clinical Pharmacology Summary; Module 2.5 for the integrated rationale; Module 5 for full reports.
- Document traceability. Clear figure captions and sources accelerate review.
Abbreviations
References
- FDA. Exposure–Response Relationships — Study Design, Data Analysis, and Regulatory Applications. 2024.
- FDA. Population Pharmacokinetics Guidance for Industry. 2022.
- EMA. Reporting of PBPK Modelling and Simulation—Scientific Guideline. 2018.
- FDA. Physiologically Based Pharmacokinetic Analyses — Format and Content. 2018.
- Shebley M, et al. PBPK in Drug Development & Regulatory Applications. CPT: PSP. 2018.
- Johnson TN, et al. PBPK Best-Practice Framework. CPT: PSP. 2021.
- Sun Z, et al. PBPK in FDA-Approved NMEs (Recent 5 Years). J Pharm Biomed Anal. 2024.
- FDA. Keytruda 400 mg Q6W Approval Announcement. 2020.
- FDA. Keytruda 400 mg Q6W Review Memo (modeled PK + KEYNOTE-555). 2020.
- Lala M, et al. Rationale for Pembrolizumab 400 mg Q6W. Cancer Treat Rev. 2020.
- Cohen G, et al. KEYNOTE-555 Cohort B. 2024.
- Wang X, et al. Nivolumab Exposure–Response. CPT: PSP. 2017;5:146–156.
- FDA OCP Review. Nivolumab 480 mg Q4W PopPK/E–R. 2018.
- Long GV, et al. Nivolumab 480 mg Q4W Safety/Exposure. Ann Oncol. 2018.
- FDA/CDER. Application of PBPK to Support Labeling Initiatives (Ibrutinib KPIs). 2019.
- Maharaj AR, et al. Pediatric PBPK Workflow Example. AAPS J. 2013.
- FDA. Pediatric Antifungal Drug Development Considerations. 2020.
- FDA/Label/Review Materials for Voriconazole (VFEND®) Pediatric Dosing/TDM Context. 2010–2022.
- FDA/CDER. Leveraging Modeling to Understand Food/GET (GLP-1). 2024.
- Peterson MC, et al. QSP for Natpara. CPT: PSP. 2015.
- Bai JPF, et al. Landscape of Regulatory QSP Submissions. CPT: PSP. 2024.